Key Statistics Summary
- The average cost per cup in an Australian office ranges from $0.08 (instant) to $1.20+ (bean-to-cup commercial machine), depending on brewing method.
- Australian office workers consume an estimated 3.4 cups of coffee per day on average, according to Roy Morgan research.
- A 50-person office can expect to spend between $18,000 and $42,000 AUD per year on workplace coffee, once equipment, consumables, and service costs are included.
- Capsule-based systems carry a per-cup cost 3 to 5 times higher than equivalent fresh-bean espresso systems at comparable quality levels.
- Australian businesses spent an estimated $2.1 billion AUD on out-of-home coffee in the workplace channel in 2024-25, according to IBISWorld.
- Hidden costs including machine downtime, waste, and staff time can add 15-25% to nominal per-cup figures.
- Fresh-bean commercial espresso remains the lowest cost-per-cup option at scale, with breakeven against capsule systems typically reached at 30+ cups per day.
Introduction
Workplace coffee is one of the most universally budgeted, and least rigorously benchmarked, line items in Australian office operations. Most finance teams inherit a coffee arrangement from whoever set it up years ago, rarely revisit it, and have little reference data to judge whether they are overpaying, under-provisioning, or simply using the wrong brewing method for their team size. For HR managers justifying coffee as a staff retention tool and office managers trying to rein in discretionary spend, the absence of clear per-cup and per-employee benchmarks makes informed decisions nearly impossible.
This reference compiles publicly available data from Australian and international sources alongside observed industry benchmarks to give procurement, HR, and facilities professionals a usable cost framework. The figures cover per-cup cost by brewing method, annual spend by office size, capsule versus bean versus instant comparisons, and the hidden cost multipliers that rarely appear on supplier quotes. Whether you are auditing an existing arrangement or scoping a new one, these benchmarks are designed to give you a grounded starting point.
1. Per-Cup Cost Benchmarks by Brewing Method
The cost per cup in a workplace setting varies significantly by brewing method. Raw ingredient cost is only one component. Equipment depreciation or rental, maintenance, water filtration, consumables such as milk and cups, and the staff time involved in preparation all contribute to a true cost-per-cup figure.
According to IBISWorld's Australian Coffee Shops industry report (ibisworld.com), the average wholesale cost of a commercial espresso blend in Australia sits between $28 and $45 per kilogram in 2025-26, depending on origin, roast profile, and supplier margin. At a standard extraction of roughly 7g per single shot (14g for a double), a kilogram of beans yields approximately 70 double-shot serves.
According to Statista (statista.com), the global average retail price for coffee capsules sits at approximately $0.45-$0.75 USD per pod; in the Australian market, branded capsule systems (Nespresso-compatible and proprietary formats) typically retail between $0.65 and $1.10 AUD per capsule, with workplace supply pricing marginally lower on volume contracts.
Instant coffee remains the lowest-cost option by ingredient cost alone. A standard 500g jar yields roughly 333 serves at the recommended 1.5g per cup, placing the ingredient cost at approximately $0.05-$0.10 per cup at typical bulk workplace pricing.
Table 1: Per-Cup Cost Benchmarks by Brewing Method (Australian Office, 2026)
| Brewing Method | Ingredient Cost/Cup | Equipment Cost/Cup* | Est. True Cost/Cup | Notes |
|---|---|---|---|---|
| Instant coffee | $0.05-$0.10 | $0.01 | $0.08-$0.12 | Excludes milk wastage |
| Pod/capsule (bulk supply) | $0.55-$0.90 | $0.05-$0.15 | $0.65-$1.10 | Higher waste rate |
| Filter/batch brew | $0.12-$0.22 | $0.08-$0.15 | $0.25-$0.40 | Lower labour cost |
| Bean-to-cup auto machine | $0.18-$0.35 | $0.15-$0.30 | $0.38-$0.70 | Includes rental/depreciation |
| Traditional espresso (commercial) | $0.20-$0.40 | $0.20-$0.45 | $0.45-$0.90 | Includes trained operator cost |
*Equipment cost per cup calculated across a 5-year depreciation or monthly rental basis at typical Australian commercial rates.
According to the Specialty Coffee Association (sca.coffee), extraction yield and grind consistency are the primary cost-control variables in commercial espresso settings. Poorly calibrated grinders and inconsistent dosing can inflate ingredient cost per cup by 20-30% through over-extraction waste and rejected shots.
For a more detailed breakdown of how these costs compound across a full financial year, the guide at boutiquecoffee.com.au/guides/real-cost-of-workplace-coffee walks through each cost layer with worked examples.
2. Annual Coffee Spend Per Employee
Per-employee coffee spend is the most useful normalised metric for benchmarking across different office sizes. It strips out the distortion caused by volume differences and allows like-for-like comparison between organisations.
According to Roy Morgan's Australian coffee consumption research, the average employed Australian drinks approximately 3.4 cups of coffee on a typical workday. Not all of those cups occur in the office. Industry supplier data suggests that workplace consumption accounts for roughly 1.5 to 2.0 cups of that daily total for office-based workers, with the remainder purchased from cafes, at home, or during commutes.
According to McCrindle's annual workforce reports (mccrindle.com.au), Australian workers are increasingly viewing workplace amenities, including quality coffee, as a meaningful component of their total employment package. In their 2024 workplace expectations survey, 61% of office workers nominated free or subsidised coffee as a valued non-monetary benefit.
According to IBISWorld, the average Australian full-time employee in an office environment consumes between 220 and 240 working days per year after accounting for annual leave, public holidays, and sick leave. At 1.75 cups per working day, that is approximately 385-420 cups per employee per year in the workplace.
Table 2: Estimated Annual Coffee Spend Per Employee by Brewing Method (AUD, 2026)
| Brewing Method | Cups/Year/Employee | Est. Cost/Cup | Annual Spend/Employee | Annual Spend (50 staff) |
|---|---|---|---|---|
| Instant | 400 | $0.10 | $40 | $2,000 |
| Pod/capsule | 400 | $0.85 | $340 | $17,000 |
| Filter/batch brew | 400 | $0.32 | $128 | $6,400 |
| Bean-to-cup auto | 400 | $0.55 | $220 | $11,000 |
| Commercial espresso | 400 | $0.70 | $280 | $14,000 |
These figures cover the cost of coffee consumed by the employee in the office. They do not include coffee served to visitors, clients, or during meetings, which can add 10-20% to total consumption volumes depending on the nature of the business.
Fair Work Australia's (fairwork.gov.au) guidance on workplace amenities notes that while there is no legislative requirement for employers to provide coffee, organisations that provide quality amenities generally report higher scores on staff engagement indices. This positions workplace coffee as a de facto component of retention spend, not simply a consumables budget.
3. Budget Benchmarks by Office Size
Office size creates significant variation in both the appropriate brewing system and the per-unit economics. A 10-person team has fundamentally different cost drivers than a 100-person office, and using the wrong system for the volume is one of the most common sources of cost blowout.
A useful framing from observing workplaces across Melbourne over 17 years of doing this: a 12-person team does not need a $15,000 Eversys, and an 80-person team will burn through a home-grade machine within a month. Right-sizing the equipment to the actual team size is where most of the cost efficiency comes from, before you even look at beans or service arrangements.
According to the Australian Bureau of Statistics (ABS) (abs.gov.au), approximately 98% of Australian businesses are classified as small-to-medium enterprises (SMEs), with the largest cohort employing between 5 and 49 people. This segment represents the majority of workplace coffee purchasing decisions in volume terms.
Table 3: Annual Workplace Coffee Budget Benchmarks by Office Size (AUD, 2026)
| Office Size | Recommended System | Est. Annual Consumables | Est. Annual Equipment Cost | Est. Total Annual Budget | Per-Employee Annual Cost |
|---|---|---|---|---|---|
| 10 staff | Bean-to-cup auto (entry) | $1,200-$2,000 | $600-$1,200 (rental) | $1,800-$3,200 | $180-$320 |
| 30 staff | Bean-to-cup auto (mid) | $3,500-$5,500 | $1,200-$2,400 (rental) | $4,700-$7,900 | $157-$263 |
| 50 staff | Commercial espresso or auto (full spec) | $6,000-$10,000 | $2,400-$4,800 (rental) | $8,400-$14,800 | $168-$296 |
| 100 staff | Commercial dual-group or multi-machine | $12,000-$20,000 | $4,800-$9,600 (rental) | $16,800-$29,600 | $168-$296 |
| 200+ staff | Multi-zone commercial fleet | $24,000-$45,000 | $9,600-$18,000 (rental) | $33,600-$63,000 | $168-$315 |
Note: These ranges assume 230 working days per year, 1.75 cups per employee per day, fresh bean espresso or auto systems, and include milk, cups, sugar, and basic consumables. They exclude one-off setup costs, water filtration installation, and any catering or client-facing coffee service.
According to Square Australia's transaction data (squareup.com/au), the average café transaction value for a single coffee in Melbourne in 2024-25 was $5.80. For a 50-person office consuming 87 cups per day, replacing those workplace cups with a café run would cost approximately $184,000 AUD per year, compared to an in-office estimated budget of $8,400 to $14,800. The in-office provision delivers a cost saving of approximately 90-92% against equivalent cafe-quality coffee purchased externally.
4. Capsule vs Fresh Bean vs Instant: Cost Comparison
The capsule versus bean versus instant debate in workplace coffee is frequently framed around taste. The more financially relevant framing is total cost of ownership over a 12-month period at a given consumption volume.
According to Euromonitor International, the Australian capsule coffee market reached approximately $650 million AUD in retail sales in 2024, with workplace and office procurement accounting for an estimated 18-22% of that volume. Growth in the workplace capsule segment has slowed as organisations at the 30-plus employee threshold increasingly migrate to commercial bean systems on cost grounds.
The crossover point where fresh-bean systems become cheaper than capsule systems on a per-cup basis, inclusive of equipment, is typically reached at around 30 cups per day. Below that threshold, capsule systems can be cost-competitive when the convenience factor and lack of maintenance overhead are considered. Above it, the per-cup cost of capsules compounds quickly.
Table 4: Capsule vs Bean vs Instant: Total Annual Cost Comparison at Three Volume Levels (AUD, 2026)
| System | 20 cups/day | 50 cups/day | 100 cups/day |
|---|---|---|---|
| Instant | $460/yr | $1,150/yr | $2,300/yr |
| Capsule (mid-range supply) | $4,030/yr | $10,075/yr | $20,150/yr |
| Filter/batch brew | $1,840/yr | $4,600/yr | $9,200/yr |
| Bean-to-cup auto (rental incl.) | $3,500/yr | $6,200/yr | $10,400/yr |
| Commercial espresso (rental incl.) | $4,100/yr | $6,800/yr | $11,500/yr |
Assumptions: 230 working days, capsule at $0.78/pod average, instant at $0.10/cup, filter at $0.32/cup, bean-to-cup and espresso at all-in cost including equipment rental, service, beans, milk, and consumables.
According to Statista (statista.com), Australian consumer preference data from 2024 shows that 74% of coffee drinkers prefer espresso-style milk-based coffee (flat whites, lattes, cappuccinos) as their primary coffee style. This is directly relevant to workplace procurement: a capsule system producing lungo-style black coffee will see a significant proportion of the team opting out, reducing consumption per head and further eroding the per-cup economics.
5. Hidden Costs Most Budgets Miss
Nominal per-cup cost and true cost-per-cup diverge materially in workplace settings. The following cost categories are frequently omitted from workplace coffee budgets.
Machine downtime and productivity loss. According to ABS labour statistics (abs.gov.au), the average full-time Australian employee earns approximately $1,900 per week in 2025-26. At that rate, a 10-minute disruption to 20 employees because the coffee machine is down costs approximately $1,583 in lost productive time, before any consideration of morale or workflow disruption. One client in a busy Melbourne office described the scene when their machine went down during peak morning hours as creating genuine disruption across the team. Reliable, regular service meant that outcome became rare rather than routine.
Water filtration. According to industry supplier data, unfiltered Melbourne tap water (which has relatively high hardness in some suburbs) can cause scale build-up that reduces machine life by 30-40% and degrades flavour consistency within 6-8 weeks of installation. A commercial water filter kit costs $180-$350 to install and $80-$150 per year to maintain. Omitting this from the budget and relying on the machine's internal scale management leads to higher repair costs and shorter equipment life.
Milk wastage. In offices using fresh milk for espresso-based drinks, spoilage and over-pouring can account for 15-25% of the milk budget. At $2.20-$2.80 per litre for commercial fresh milk, a 50-person office using 10 litres per day will waste between 1.5 and 2.5 litres daily if not managed. That equates to $1,150-$2,100 per year in milk waste alone.
Consumable overheads. Paper cups (if used), stirrers, sugar, alternative milks, and cleaning tablets collectively add $0.05-$0.15 per cup to the true cost. In offices providing a full range of options, alternative milks (oat, almond, soy) typically cost 2-3 times the price of standard dairy milk, and their inclusion in the default offering adds meaningfully to the annual consumables line.
Staff time for preparation and restocking. In offices without a dedicated barista or serviced machine arrangement, the administrative and preparation overhead of managing coffee supplies falls to office managers or rotating staff. According to Fair Work Australia (fairwork.gov.au), this time carries an implicit cost at the applicable award or enterprise agreement rate.
Table 5: Hidden Cost Multipliers in Workplace Coffee Budgets
| Hidden Cost Category | Typical Annual Impact (50-person office) | Frequency Budgeted |
|---|---|---|
| Machine downtime / productivity loss | $500-$3,000 | Rarely |
| Water filtration maintenance | $80-$150 | Sometimes |
| Milk spoilage and wastage | $1,150-$2,100 | Rarely |
| Alternative milk uplift | $800-$1,600 | Sometimes |
| Consumables (cups, cleaning) | $600-$1,200 | Sometimes |
| Staff time (restocking, prep) | $1,000-$3,000 | Very rarely |
| Total hidden cost range | $4,130-$11,050 |
6. Australian Market Statistics
Australia's workplace coffee market operates within a broader national coffee culture that is among the most developed in the world by per-capita consumption and quality expectations.
According to IBISWorld's Coffee Shops in Australia report (ibisworld.com), the Australian coffee industry generated approximately $12.4 billion AUD in revenue in 2024-25, with the workplace and commercial channel representing an estimated 17% of total consumption volume.
According to Roy Morgan research (roymorgan.com), 46% of Australians drink coffee on any given day, with the 25-54 age bracket (the core office workforce demographic) reporting the highest frequency of consumption. Melbourne and Sydney office workers report higher daily consumption rates than the national average, with Melbourne consistently recording the highest per-capita coffee consumption of any Australian city.
According to the ABS (abs.gov.au), Australia had approximately 2.5 million people employed in office-based roles in capital cities as of 2024. At average workplace consumption of 1.75 cups per person per working day, the aggregate workplace coffee volume across the Australian office sector exceeds 1 billion cups annually.
According to McCrindle (mccrindle.com.au), workplace flexibility arrangements have introduced a new complexity into workplace coffee budgeting: hybrid work models mean that per-day office attendance varies by 20-40% across the working week, with Tuesday, Wednesday, and Thursday seeing peak office occupancy and Monday and Friday seeing significantly lower attendance. For offices provisioning on a flat daily basis, this creates structural waste on low-attendance days.
According to the ACCC (accc.gov.au), the cost of green coffee beans imported into Australia increased by approximately 38% between 2022 and 2025, driven by supply constraints in key growing regions including Brazil and Vietnam. This upstream cost pressure has flowed through to roasted bean wholesale prices and, subsequently, to workplace supply contract pricing. Procurement managers reviewing multi-year supply contracts signed before 2023 may find their current pricing is materially below replacement cost, making renewal negotiations more complex.
Australia's specialty coffee sector, as tracked by the Specialty Coffee Association of Australia, has seen accelerating adoption of single-origin and micro-lot beans in workplace settings as employees familiar with Melbourne's specialty cafe culture raise their expectations for office coffee quality. This shift is relevant to per-cup cost benchmarking: specialty-grade beans cost $55-$90 per kilogram wholesale compared to $28-$45 for commercial blends, representing a 50-100% ingredient cost premium.
7. How Australian Offices Are Reducing Coffee Costs in 2026
Cost reduction in workplace coffee is not simply a matter of switching to a cheaper system. The approaches that deliver durable savings without degrading quality or staff satisfaction tend to focus on right-sizing, waste reduction, and supply structure.
Right-sizing the machine to actual volume. The most common source of overspend is using a machine spec designed for higher volumes than the team actually generates. A machine with a daily capacity of 300 cups in a 20-person office is not just unnecessary, it is often counterproductive, as commercial machines require minimum daily cycle volumes to maintain optimal performance and justify their rental or depreciation cost.
Consolidating supply to a single accountable provider. Offices managing separate contracts for machine rental, bean supply, maintenance, and consumables consistently report higher total costs and more service friction than those using a single provider. The administration cost of managing multiple vendor relationships carries an implicit overhead that rarely appears in the budget.
Moving from capsule to bean at scale. For offices currently on capsule systems consuming more than 30 cups per day, the migration to a commercial bean-to-cup system typically delivers a per-cup cost reduction of 30-50% at comparable quality levels. The transition cost is low when the machine is supplied on a rental basis with no capital outlay required.
Implementing consumption tracking. Offices that track weekly consumption volumes against attendance can identify waste patterns and adjust provisioning accordingly. This is particularly relevant under hybrid work models where Monday and Friday office populations may be 30-50% of mid-week peaks.
Reviewing supply contracts annually. Given the 38% increase in green bean costs between 2022 and 2025, supply contracts that were competitive when signed may now be either above or below market. An annual benchmarking review, using the per-cup and per-employee figures in this article as reference points, allows procurement teams to negotiate from an informed position.
For offices wanting to benchmark their specific setup against these figures, boutiquecoffee.com.au/contact offers a no-obligation cost comparison service.
Methodology Note
The benchmarks in this article are derived from a combination of publicly available industry research, ABS economic and labour statistics, Roy Morgan consumer data, IBISWorld industry reports, Statista market data, and observed cost structures across commercial workplace coffee supply in the Melbourne market. Per-cup cost figures are modelled estimates based on typical ingredient, equipment, and service costs at each volume tier and should be treated as reference ranges rather than precise figures. Individual workplace costs will vary based on supplier pricing, consumption patterns, machine type, location, and the inclusion or exclusion of consumable categories. All figures are in AUD and reference the 2025-26 period unless otherwise stated.
Statistics sourced from publicly available research and industry reports. Verify individual figures before publishing or relying on them for financial planning purposes.
Key Takeaways
- Per-cup cost in Australian offices ranges from $0.08 to $1.10+ depending on brewing method. Capsule systems are typically 3 to 5 times more expensive per cup than commercial espresso at comparable quality.
- The breakeven point where fresh-bean systems become cheaper than capsule systems is approximately 30 cups per day. Above this volume, bean-to-cup or commercial espresso delivers materially lower total cost.
- Hidden costs including machine downtime, milk wastage, water filtration, and staff time can add $4,000 to $11,000 per year to the nominal coffee budget of a 50-person office.
- Annual per-employee coffee spend in Australian offices ranges from approximately $40 (instant) to $340 (capsule), with commercial espresso systems sitting at $220-$280 per employee per year inclusive of all costs.
- Hybrid work models create structural waste in flat-provisioned coffee budgets. Consumption tracking aligned to attendance data is the most effective waste-reduction lever available.
- Right-sizing the equipment to the actual team size, rather than defaulting to a high-spec machine, is consistently the single largest determinant of per-cup cost efficiency.
- Australian offices reviewing supply contracts signed before 2023 should benchmark against current green bean pricing, which has increased approximately 38% since 2022.
Sources
- IBISWorld, "Coffee Shops in Australia" industry report, 2024-25. Available at: https://www.ibisworld.com/au/industry/coffee-shops/
- Roy Morgan, Coffee Consumption in Australia research data, 2024. Available at: https://www.roymorgan.com
- McCrindle, Workforce and Workplace Expectations Reports, 2024. Available at: https://www.mccrindle.com.au
- Australian Bureau of Statistics (ABS), Labour Force Statistics and Business Register data, 2024-25. Available at: https://www.abs.gov.au
- Statista, Coffee market data Australia and global capsule pricing, 2024-25. Available at: https://www.statista.com
- Fair Work Australia, Workplace Amenities and Conditions guidance. Available at: https://www.fairwork.gov.au
- Australian Competition and Consumer Commission (ACCC), commodity price monitoring data. Available at: https://www.accc.gov.au
- Square Australia, Transaction Benchmarks and Average Order Value Data, 2024-25. Available at: https://squareup.com/au
- Specialty Coffee Association, Extraction Standards and Commercial Yield Data. Available at: https://sca.coffee
- Euromonitor International, Packaged Coffee and Hot Drinks in Australia, 2024.
- Specialty Coffee Association of Australia, Industry Reports and Member Data, 2024-25.
- Boutique Coffee at Work, observed workplace client data across 200+ active Melbourne clients, 2026.
Frequently asked questions
Is office coffee tax deductible for Australian businesses?
Generally, yes. The ATO allows businesses to claim deductions for expenses incidental to providing employee amenities on business premises, including coffee and tea. Where coffee is provided to employees on the business premises as a general amenity, it is typically treated as a deductible business expense rather than a fringe benefit, and is not subject to FBT. Businesses should confirm the specific treatment with their accountant or refer to current ATO guidance.
What is the average markup on office coffee capsules compared to fresh bean supply?
Capsule systems carry a per-cup cost that is typically 3 to 5 times higher than an equivalent-quality commercial espresso system at volumes above 30 cups per day. The premium exists due to manufacturer margins embedded in the capsule price and the proprietary lock-in of closed-format systems.
Is there a budget template for planning office coffee costs?
A functional office coffee budget template should cover: machine rental or depreciation; bean or capsule supply; milk; consumables (cups, sugar, cleaning tablets); water filtration maintenance; and a service contingency of 5-10% of equipment cost. The benchmarks in this article provide starting-point ranges by office size.
How much does a bean-to-cup automatic machine cost per cup in an Australian office?
A commercial bean-to-cup automatic machine in an Australian office costs approximately $0.38 to $0.70 per cup on a fully loaded basis, including machine rental, beans, milk, and consumables. The per-cup equipment cost decreases significantly as daily cup volume increases.
How can I benchmark my own office's coffee costs against industry figures?
Calculate total annual spend across machine rental, beans or capsules, milk, consumables, and service costs. Divide by working days and average daily staff attendance to get a cost per person per day, then divide by average cups consumed per person to arrive at a cost per cup. Compare against the benchmarks in this article for your brewing method and office size.
How does hybrid work affect workplace coffee budgeting?
Hybrid work creates structural waste in flat-rate provisioning because mid-week office attendance runs 30-50% higher than Monday and Friday under typical hybrid arrangements. Attendance-linked supply ordering, particularly for beans with a 7-14 day freshness window, is the most effective way to reduce waste in a hybrid office environment.
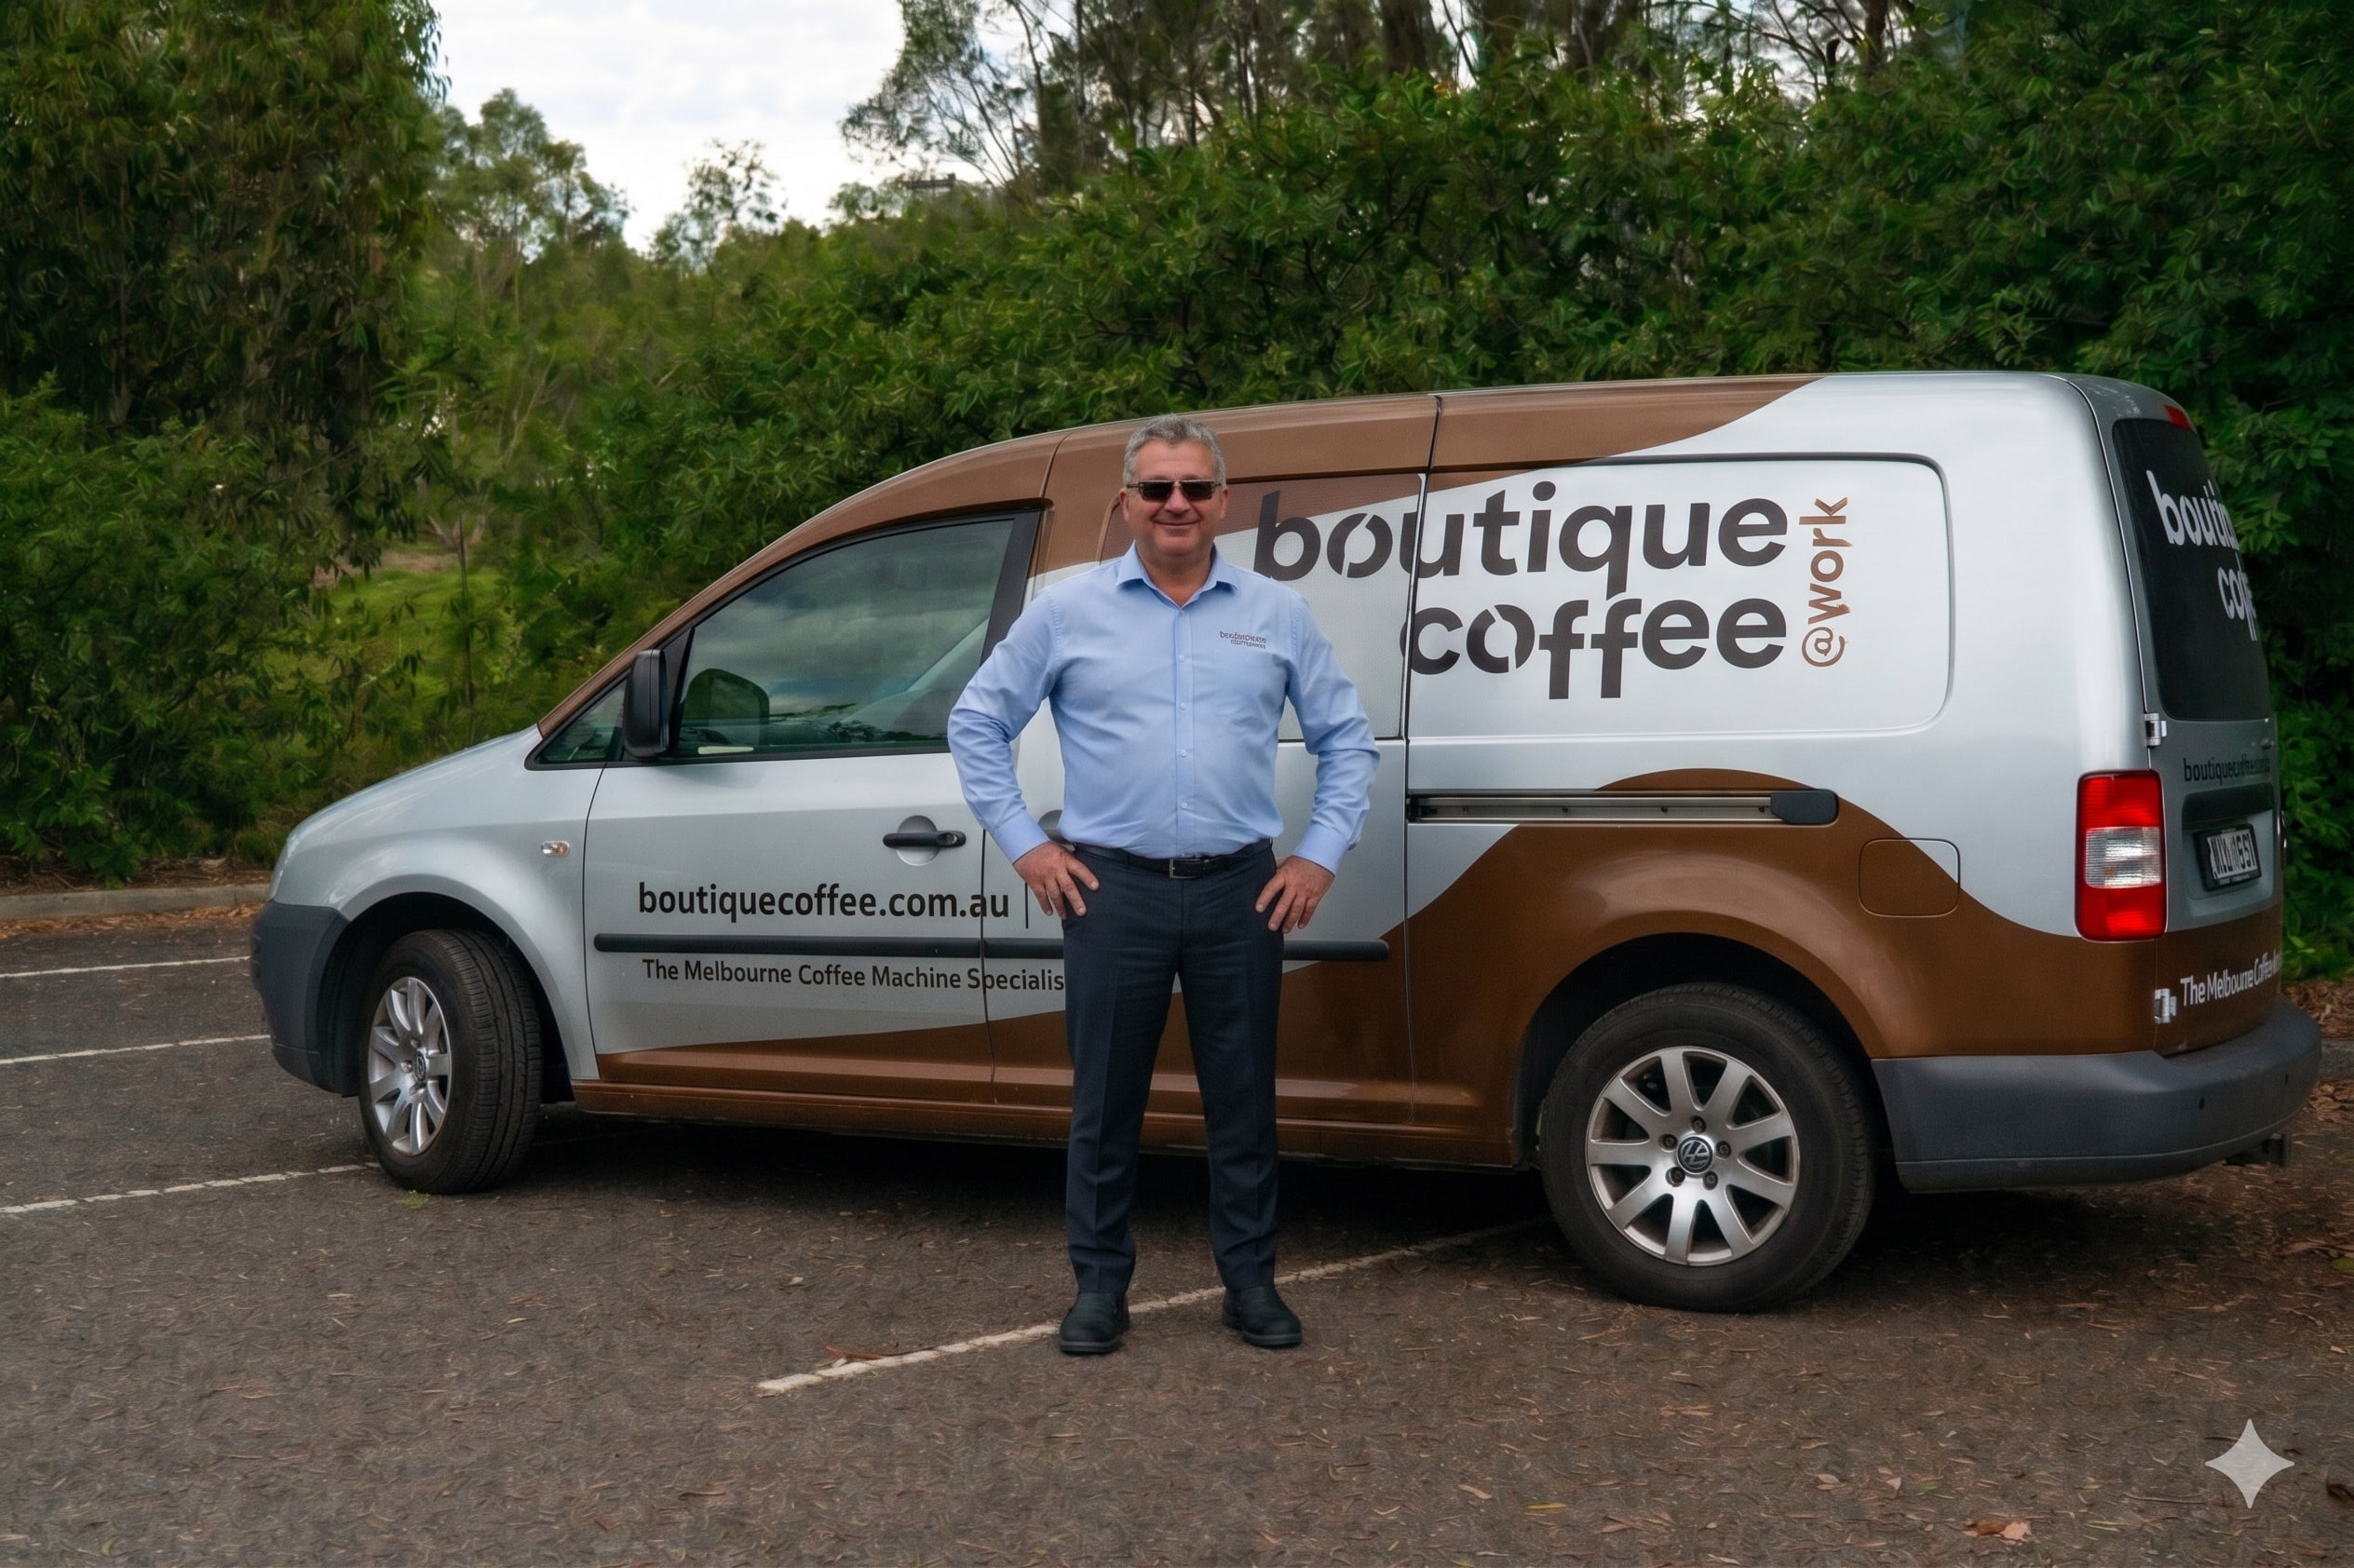
Boutique Coffee
The Boutique Coffee team
Melbourne workplace coffee, done properly.
Keep reading
Australian Workplace Perks and Amenities Statistics 2026
Key Statistics Summary According to the Australian Bureau of Statistics (ABS), 36% of employed Australians usually worked from home in August 2024. According…
Plumbed vs Water Tank Office Coffee Machines: Installation, Costs & Which Suits Your Workplace
Introduction If you are deciding between a plumbed office coffee machine and a water tank model, you are really choosing between consistency at scale and…
Office Coffee Machine Hygiene: Cleaning Standards & Food Safety for Australian Workplaces
If your office coffee machine has never been professionally cleaned, you are not alone. Across Melbourne workplaces, I see the same pattern repeatedly: a…